Introduction
Delhi, the bustling capital city of India, records higher temperatures every year during summer. The summer of 2023 recorded the highest temperature of 2023 at 42.9°C in May (Akhtar, 2023). Surrounding semi-urban areas around Delhi, such as Basai and Jhajjar, also witnessed high temperatures throughout the same month; however, while Delhi experienced an average temperature high of 40-42°C, it remained at 39°C for these areas. This variation in temperature is attributed to the urban heat island effect in cities. An urban heat island occurs when a city experiences temperatures warmer than its surrounding rural or semi-urban areas. The reasons behind this phenomenon are plenty, including the green cover, population density in urban areas, and lifestyle elements, such as additional cooling requirements and vehicular emissions.
In India, air pollution has also contributed to heat-trapping. It is one of the main reasons behind the creation of localisation temperature hotspots; nearly seven such urban heat islands (UHIS) have been found in Delhi, according to Indian Institute of Tropical Meteorology (Singh, 2014). In addition to these factors, hard, dry surfaces in urban areas, such as roofs, sidewalks, roads, building and parking lots, provide less shade and moisture than natural landscapes (US EPA, 2023). The urban material properties and use of concrete that absorbs heat, along with the geometry of cities with narrow streets, block natural wind flow, disallowing cooling effects to set (US EPA, 2023).
The phenomenon raises concerns for health and mortality in urban populations as it increases the occurrences of heat waves during the summer. In May 2023, heatwave warnings were issued by the Indian Meteorological Department (IMD) for more than two weeks. To tackle this, the Delhi Disaster Management Authority also launched a Delhi Heat Wave Action Plan 2023, which focused on profiling hotspots, vulnerability, and mitigation measures.
Case of Delhi: Population Density Challenges and Green Cover
Delhi is an overwhelmingly urban megacity with a population density as high as 18,150 persons per square km. It is the largest state by population, followed by Chandigarh at 10,719 persons per square km (Rathore, 2023).
The challenges associated with Delhi’s growing urbanisation and large population are high, both in number and magnitude. The correlation between urban population and the heat island effect has been studied for over a decade now. Human activities associated with extensive use of vehicles, industrial processes and energy consumption in urban areas exacerbate the UHI effect (Jha, 2023). Naturally, a larger population directly means more energy consumption, a growing need for residential and commercial spaces and increased transportation requirements.
A study conducted by the World Resources Institute (WRI) on the Urban blue-green conundrum measuring the impacts of urbanisation on natural infrastructure takes a look at Delhi. It uses remote sensing technology and satellite imagery to monitor the green cover loss in Delhi. It observed that the built-up area (comprising buildings) had increased by 61% between 2000 and 2015 in the 0-50 km region.In comparison, cities such as Kolkata and Ahmedabad experienced an increase in built-up area of 19% and 46%, respectively. However, the most expansion in built-up areas was observed in Bangalore, which increased by 76% (Goswami et al., 2023).
The green cover for Delhi has significantly gone down; in 1977 the total main greens in Delhi covered nearly 17.32% of the area and reduced to 10.45% in 2006 (Naidu, 2022). The 2021 Master Plan for Delhi slightly deviates from earlier plans and does not mention forest cover in the greenbelt space. It also does not include city forests in recreational spaces. As reported, in 2021 the total geographical area with green cover has gone up to 13.15% (Govt of NCT of Delhi, 2022). Yet, the parameters and definitions of consideration for green cover and forests have changed over time, which is a major setback in assessing how much of this difference translates from paper into reality.
As an economic hub, cities like Delhi and Bangalore are exposed to high internal migration. Despite regulations to control vehicular emissions and promote public transport, the everyday movement of people in Delhi also continues to witness high levels of vehicular emissions. The estimated figures for Delhi in the 1990s were over 3000 metric tonnes of air pollutants every day and vehicular pollution was responsible for 67% of the total air pollution load in the city (NCT, n.d). The number of private car ownership has only gone up from 0.56 million units in 1994 to 3.38 million units in 2021 (Statista, 2022).
These anthropogenic factors, combined with the change in weather patterns and increased heat waves due to climate change, have put Delhi in a weak spot. The Master Plan for Delhi to 2021 embeds heat resilience alongside other climate and development considerations; however, this would require a roadmap that can not only tackle the population density challenges but also increase investment.
UHI Effect in Delhi
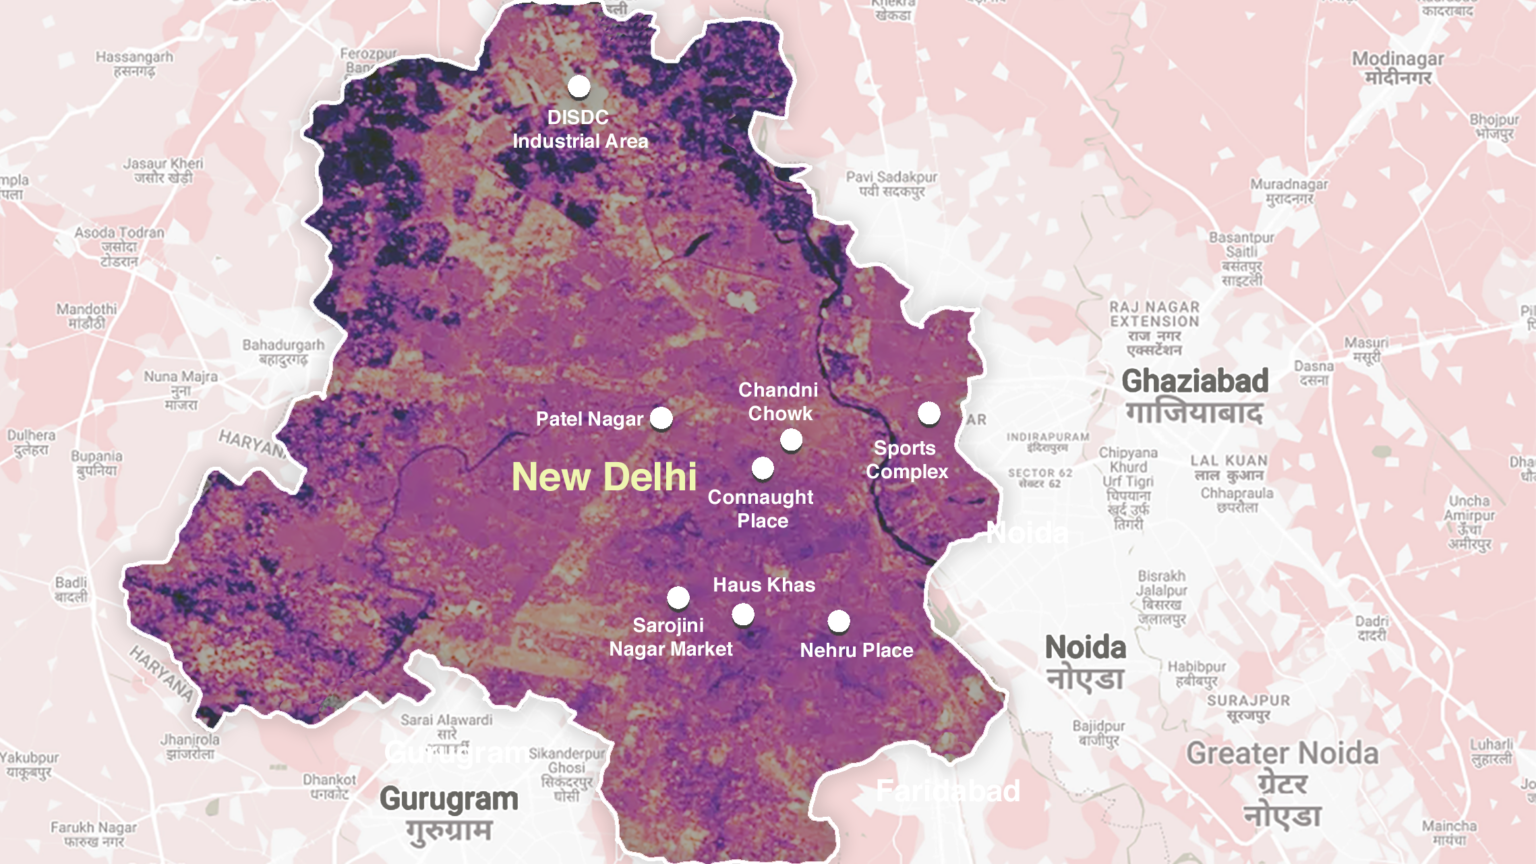
A micrometeorological experiment conducted on understanding the UHI effect in Delhi in 2009 revealed that major UNI zones in Delhi were commercial centres and densely populated residential areas, which included Sitaram Bazar, Connaught Place (CP), Bhikaji Cama and Noida (Mohan et al., 2009).
Over the last 15 years, since this micrometeorological experiment, the weather stations across Delhi have noted anomalies in the weather pattern with increasing heat waves. In April 2022, eight out of twelve stations in Delhi-NCR recorded a maximum temperature of 43 degrees Celsius, with the Akshardham Sports Complex area recording the highest maximum temperature at 45 degrees Celsius (PTI, 2022).
A common trend noted in these high-temperature areas is that most of them are residential or commercial areas with high population density. This data backs up the assumption that the increase in concretization has established ‘Heat pockets’ and ‘Heat Islands’ in the national capital (Kumar, 2022). Although the concept of this interaction influencing microclimate was first introduced in 1982, the evidence to show how these factors play out in part of megacities like Delhi continues to add up.
Presently, there are at least 60 urban heat islands around the city with a major concentration in parts of southeast and central Delhi. A study by the Centre for Atmospheric Science, IIT-Delhi, found in 2020 a 2-4 degrees increase in night time canopy level heat islands in densely built-up regions in NCR, for example in Dwarka (Dixit, 2022). The same study also highlights the health implications of heat waves, observing a direct correlation between the heat island peaks and heat-related illness (Dixit, 2022).
Increasing Health Implications and Economic Slowdown
India, with its tropical climate, is not new to heat exposure; however, the intensity of the heat waves has increased multifold in the last few years. The rising temperatures in Delhi are not simply a matter of discomfort; they pose significant health risks and contribute to economic slowdowns. Long-term projections indicate that by the year 2050, Indian heat waves could exceed the survivability limit for a healthy human, even in the shade (Regan, 2023).
A study on the lethal heat waves posed by the increasing heat waves found that since 1992, more than 24,000 people have died from heat-related complications and illnesses (Regan, 2023). The heatwaves increase pressure on the public health infrastructure. It also slows down the outdoor and labour activities. Estimates show a 15% decrease in outdoor working capacity during daylight hours due to the extreme heat by the year 2050 (Debnath et al., 2023).
In 2022, one of the warmest years in recent history, Delhi hospitals reported a spike in heat-related ailments (Pillai, 2022). A majority of those with symptoms were found to be women and senior citizens who reported dehydration, cramps, dizziness and fluctuations in blood pressure. Another pressure that adds to this problem is the level of preparedness that is available in the healthcare sector to deal with heat-related illness from diagnosis to treatment.
Gendered differences also exist; women become particularly more susceptible to illnesses and fatal accidents due to physiological factors, while men reportedly have more incidence of heat stroke (Atele et al., 2022). Labourers and construction workers bear the major brunt of the heat, despite producing just 9 per cent of New Delhi’s output, they account for one-third of the city’s losses due to labour-intensive activities and 60 per cent of working hours spent outdoors.
Nearly 57 million workers in India participate in these outdoor labour-intensive activities, 7 million of whom are women (PTI, 2023). Furthermore, the heat spots can exacerbate air pollution, which is another challenge of healthcare in India. Increased temperatures can worsen the effects of air pollution, leading to respiratory and cardiovascular issues.
Heat Wave Action Plan Delhi Draft
The Heat Wave Action Plan Draft of Delhi addresses and represents an adaptive strategy to the challenges of the increasing heat waves in the city to different sectors, including sanitation, water, electricity, etc. It bases its observations on key data collected since 2010-12 and thermal hotspot mapping. It brings some key features to the planning in Delhi, such as:
1. Early Warning Signs and Forecasts: The plans include an early warning system to alert the residents about the impending heat waves, which allows for citizens to prepare their response measures.
2. Developing Healthcare capacity: It extends its strategy to the healthcare sectors’ capacity building and training to recognize and respond to heat-related illness, particularly during extreme heat events.
3. Public Awareness: The action plan also actively seeks to increase public awareness through campaigns to educate residents about adaptive measures, heat-related illnesses, preventive measures and behavioural tactics.
4. Cooling Centers: One of the most interesting initiatives is the provision of cooling centres across the city to provide relief to vulnerable populations, including the elderly, homeless and people without access to air conditioning.
5. Emergency Response Protocols: It plans to establish protocols for emergency response, including but not limited to medical assistance and evacuation for high- risk areas.
Although the action plan is one of the preliminary steps in planning to counter the challenges of heatwaves and increasing risks for the megacity of Delhi, there are certain gaps that need to be addressed.
One of the primary concerns is that while it focuses on adaptive measures, it does not look into mitigating the creation of hotspots or urban heat islands. The action plan must also address the issues of planning and construction by encouraging the use of building materials that do not create heat traps. Another constraint is the insufficient infrastructure for cooling centres and lack of proper maintenance of existing facilities and funding, which may hinder the effective implementation of the plan, limiting its scale and scope.
Conclusion
The increasing prevalence of UHI in Delhi presents significant challenges and threatens life and economy. Delhi, like many other rapidly urbanised cities, faces the phenomenon of UHIs increasing due to the proliferation of concrete structures, roads and lack of green spaces. In planning for action to counter these challenges, the government must first recognise the priority in pushing back on traditional construction methods.
A multi-pronged approach is essential to counter the challenges of urban heat islands and heat-trapping in Delhi. While the Heat Wave Action Plan of Delhi is commendable in its efforts, it is not without its limitations. To effectively mitigate the health implications of heat hotspots and ensure the resilience of Delhi’s growing population, it is essential to address the shortcomings of this action plan. While focusing on improving access to cooling infrastructure, the government must address socio-economic disparities and foster community resilience. A robust evaluation and monitoring are essential and there needs to be an overall expansion of green spaces in city planning. Increasing the permeability of surfaces by using high-albedo materials and setting up cool roofing technologies, terrace gardens, etc. can help reduce surface temperature. Through national missions such as the Lifestyle for Environment (LiFE Mission), the government can promote behavioural change in people to set up these technologies in their houses.
A more stringent approach to policies, especially those aimed at reducing vehicular emissions and promoting energy-efficient building design, must be taken into consideration. Though the prospect of mitigating heat waves and UHIs may seem distant, concerted efforts from both the government and citizens can pave the way for a more resilient and sustainable urban environment in Delhi.