Author: Yashoroop Dey
The 2024 Indian general elections was the largest, and consequently, the most expensive election ever held, in the world. Notably, social media emerged as a dominant theatre of political campaigning, with parties spending large amounts of money on advertising, on platforms such as Meta, and on running Google advertising campaigns. However, the large-scale embrace of “politicking” via social media for high profile political events, such as general elections, underscores the need to discuss the nature of political communication, advertising, and campaigning on social media in a way that differs from traditional platforms such as physical media (news, hoardings, flyers, rallies), or other electronic media (television and radio).
Social media offers a unique space wherein individuals can be targeted via algorithms, from fence-sitters to political allies among voters, while also being the only platform without a conscious “buy-in” mechanism. For non-social media politics, a voter is expected to turn on the television, read the paper, or attend a rally–whereas, in the case of social media, the advertising becomes embedded in the natural social media habits of an individual, with platforms having the ability to tailor the timing, content and nature of the advertising to the individual’s preferences and behaviour. Thus, the seamlessness of social media advertising, coupled with rising reliance and globally increasing hours spent on social media for news, entertainment and information, results in a unique opportunity for parties to achieve a degree of last-mile connectivity of their political campaigns–a voter is accessible at all times, without any explicit opt-in, and in a manner that is difficult to ignore.
It is no wonder, then, that parties whole-heartedly embraced this space, and the juggernaut of political campaigning and information has created unique ways of leveraging this space to appeal to the voters. As a result, the social media behaviours of parties also stand to shed a light on the attitude of the party towards a certain political contest in the first place–an initial analysis reveals that wherever a party has expected a fierce political contest, they have significantly increased their expense on social media for that particular contest. However, the outcome of fierce political contests seem to not be affected by the social media campaign and investment, possibly implying that social media has emerged as a tool of rapid information competition, whose effects on political choice formation remains unclear.
Information Channels and Voter Attitudes
A discussion on political campaigning through social media and its reach underscores an exploration for how individuals interact with information regarding politics at all. Information seeking patterns are not monolithic, and a 2022 study done by C-Voter and SPRF India identified potential partisanship driven biases in how citizens feel exposed to political information as well.
The author has conducted a national survey, along with C-Voter (an Indian international polling agency headquartered in Delhi), to gauge citizen exposure to information regarding issues they deem important for national elections. Respondents were also classified as those who voted for the BJP/National Democratic Alliance (NDA) in the last general elections, and those who voted for any opposition party. The goal of the study was to check the self-perception and exposure of voters towards key issues, and any possible effects that partisanship may have on this exposure. The study discussed the possibility of echo chambers in Indian politics, formed as a result of algorithmically targeted advertising, driven solely by social media.
One of the questions in the study also checked the sources from which respondents believe they get most of their primary information regarding election issues. Here, social media platforms and television news channels emerged as the overwhelming source of information for most respondents, regardless of partisanship, with almost 30 per cent of respondents (NDA, opposition and total) stating they got their information primarily from social media, while 30 per cent of all respondents saying they get their information primarily from news channels (see figure below).

Figure 1. Survey responses to the question “Which of the following do you use the most to follow news and current affairs?”
Source: Calculations from Author’s survey data.
Individuals were also asked about their information seeking behaviour, to assess how a voter felt they interacted with information regarding politics. Here, significantly more NDA aligned voters appeared to seek information regarding politics “very actively”, as compared to opposition aligned voters.

Figure 2. Survey responses to the question “How actively do you try to seek information and news through sources like newspapers, TV etc regarding the actions taken by the national government on the issues discussed in their party manifestos?”
Source: Calculations from Author’s survey data.
The study indicates that voter preferences (whether incumbent or opposition aligned), may play a role in a voter’s exposure to political information, and the medium through which they engage with the same. Incumbent aligned voters tend to rely more on television than opposition aligned ones, and exhibit significantly higher levels of active information seeking. However, social media, as a medium, remains second, only after television, and exhibits no such partisanship effects. This indicates a homogenous playing field when it comes to social media as a platform for political parties to disseminate information, and thus, as the remaining sections of the paper will suggest, social media emerges as equally important for all key political players, regardless of their ideology or electoral strategy.
Figure 3 shows the breakdown of the three major publicity expense overheads made by parties during the 2019 general election (the figures for 2024 are not yet available at the time of writing this paper). Here, media advertisements (which includes print, television, and social media), emerge as the overwhelmingly highest share. The large share of media advertising, coupled with the growing reliance of voters on television and social media, showcases how political campaigning has increasingly taken on a digital nature.

Figure 3. Publicity Expense Incurred During the 2019 General Elections
Source: Calculated by the Author using ECI data.
Methods and Limitations of Data
The remaining sections of this paper uses data from Google Ad Centre and Meta Ad data to track the trends of political campaigning on social media by political parties. However, the aggregation of such data comes with some difficulties–Meta only allows data for 3 months at a time, and the period for which data was available during the writing of this paper was May to August. Data in the time running up to the election is missing. Google groups ads under “political content” as determined by its algorithm and keywords, and thus, may over- or underspecify the total number of such ads by a small margin.
Most of the conversation on elections is normative, as rigorous studies of the same are not yet available. Thus, the perceptions are objective and formulated by the author based on generally available discussion, instead of proven and hard metrics.
An electoral “upset”is indicated as an outcome that the party was not expecting, whereas an electoral “success” is indicated as one where the party performed better than expected, by conventional wisdom. This discussion has been for the General Elections of 2024 only, except for Odisha, which had simultaneous Assembly elections.
Meta And Google Advertising
One of the main areas of social media advertising was advertising on Meta, formerly known as Facebook. This involved the platforms of Facebook, Instagram and Whatsapp Messenger. The BJP emerged as the leading spender in Meta advertisements, followed by the Congress. A substantial portion of the campaign was orchestrated through proxy pages, predominantly aligned with the BJP’s interests (indicated in Table 1 below by the orange coloured cells, while the opposition aligned pages are coloured blue). This network of surrogate pages acted as a form of advertising that could be more partisan, and push the limits allowed by the Model Code of Conduct, as the actions of the pages could not be directly tied back to any party. Surrogate advertising also emerged notoriously difficult to govern, as the owners of such pages were difficult to identify. As a result, surrogate pages often had posts that vilified parties and communities, with a possible aim to polarise opinion in unethical ways.


Figure 4. Surrogate Advertising on Meta for May 11-August 8, 2024
Source: Author’s calculations.
The BJP held an overwhelmingly large share of the money spent on Meta advertising, as seen in Figure 4. The second highest was by the Congress, which was about a third of what the BJP had spent. This trend follows the patterns of the Electoral Bonds as well, where the BJP emerged as the highest recipient of funds through electoral bonds, with Congress emerging second (however, almost a third of the funds collected by the BJP), and the All India Trinamool Congress emerging third.
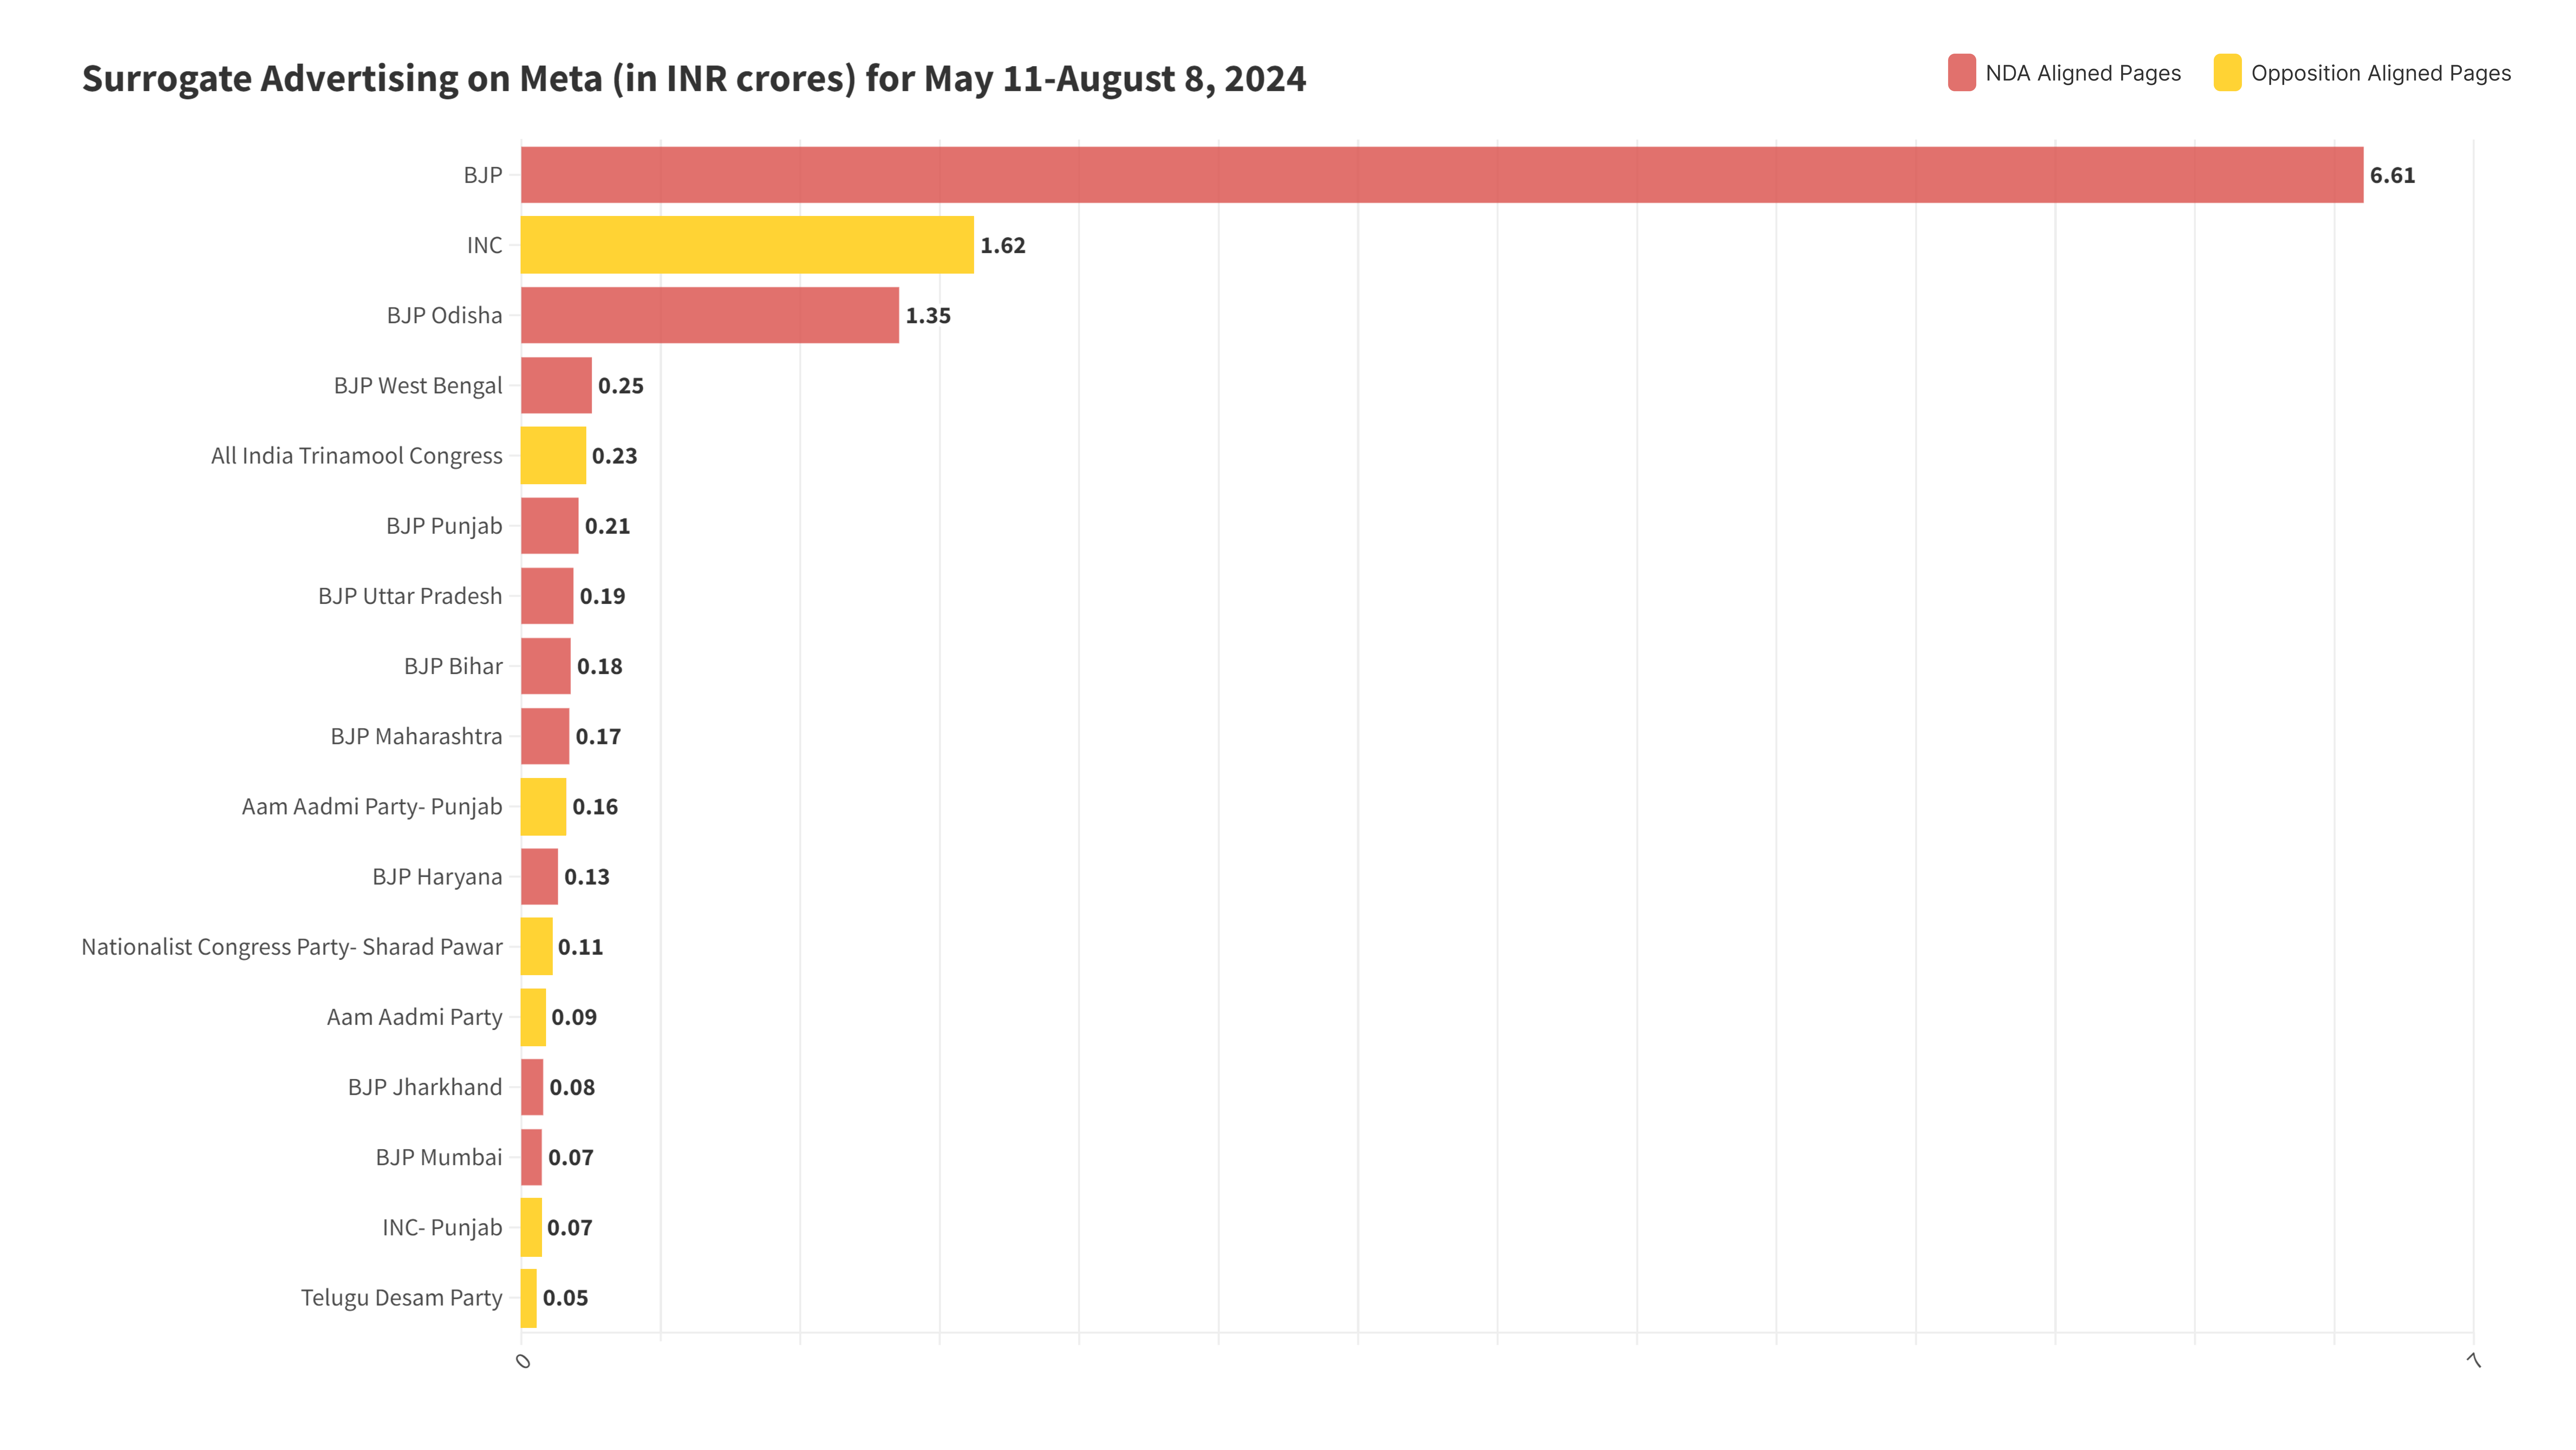
Figure 4: Ad Spend by Political Parties on Meta for May 10 – Aug 9, 2024
Source: Author’s own calculations.
YouGov Surveys indicate that in urban India, 76% attest to having been exposed to political advertisements during this general election, with 14% reporting otherwise. Of them, eight out of every 10 acknowledge the visibility of advertisements affiliated with the BJP. Exploring the state-wise expenditure serves as an indicator of the intensity of electoral competition within each respective state, and the intensity of the contest.
For the BJP, the approach involved extending their influence into the southern and eastern regions, while maintaining their prevalence in north and west India. Accordingly, their social media strategy was tailored distinctively. While Figure 4 indicates the overwhelming spending power of the BJP on social media, compared against those of Opposition parties, Figures 5 and 6 shed light on the state-wise contests that the major incumbent and opposition party deemed important and close.
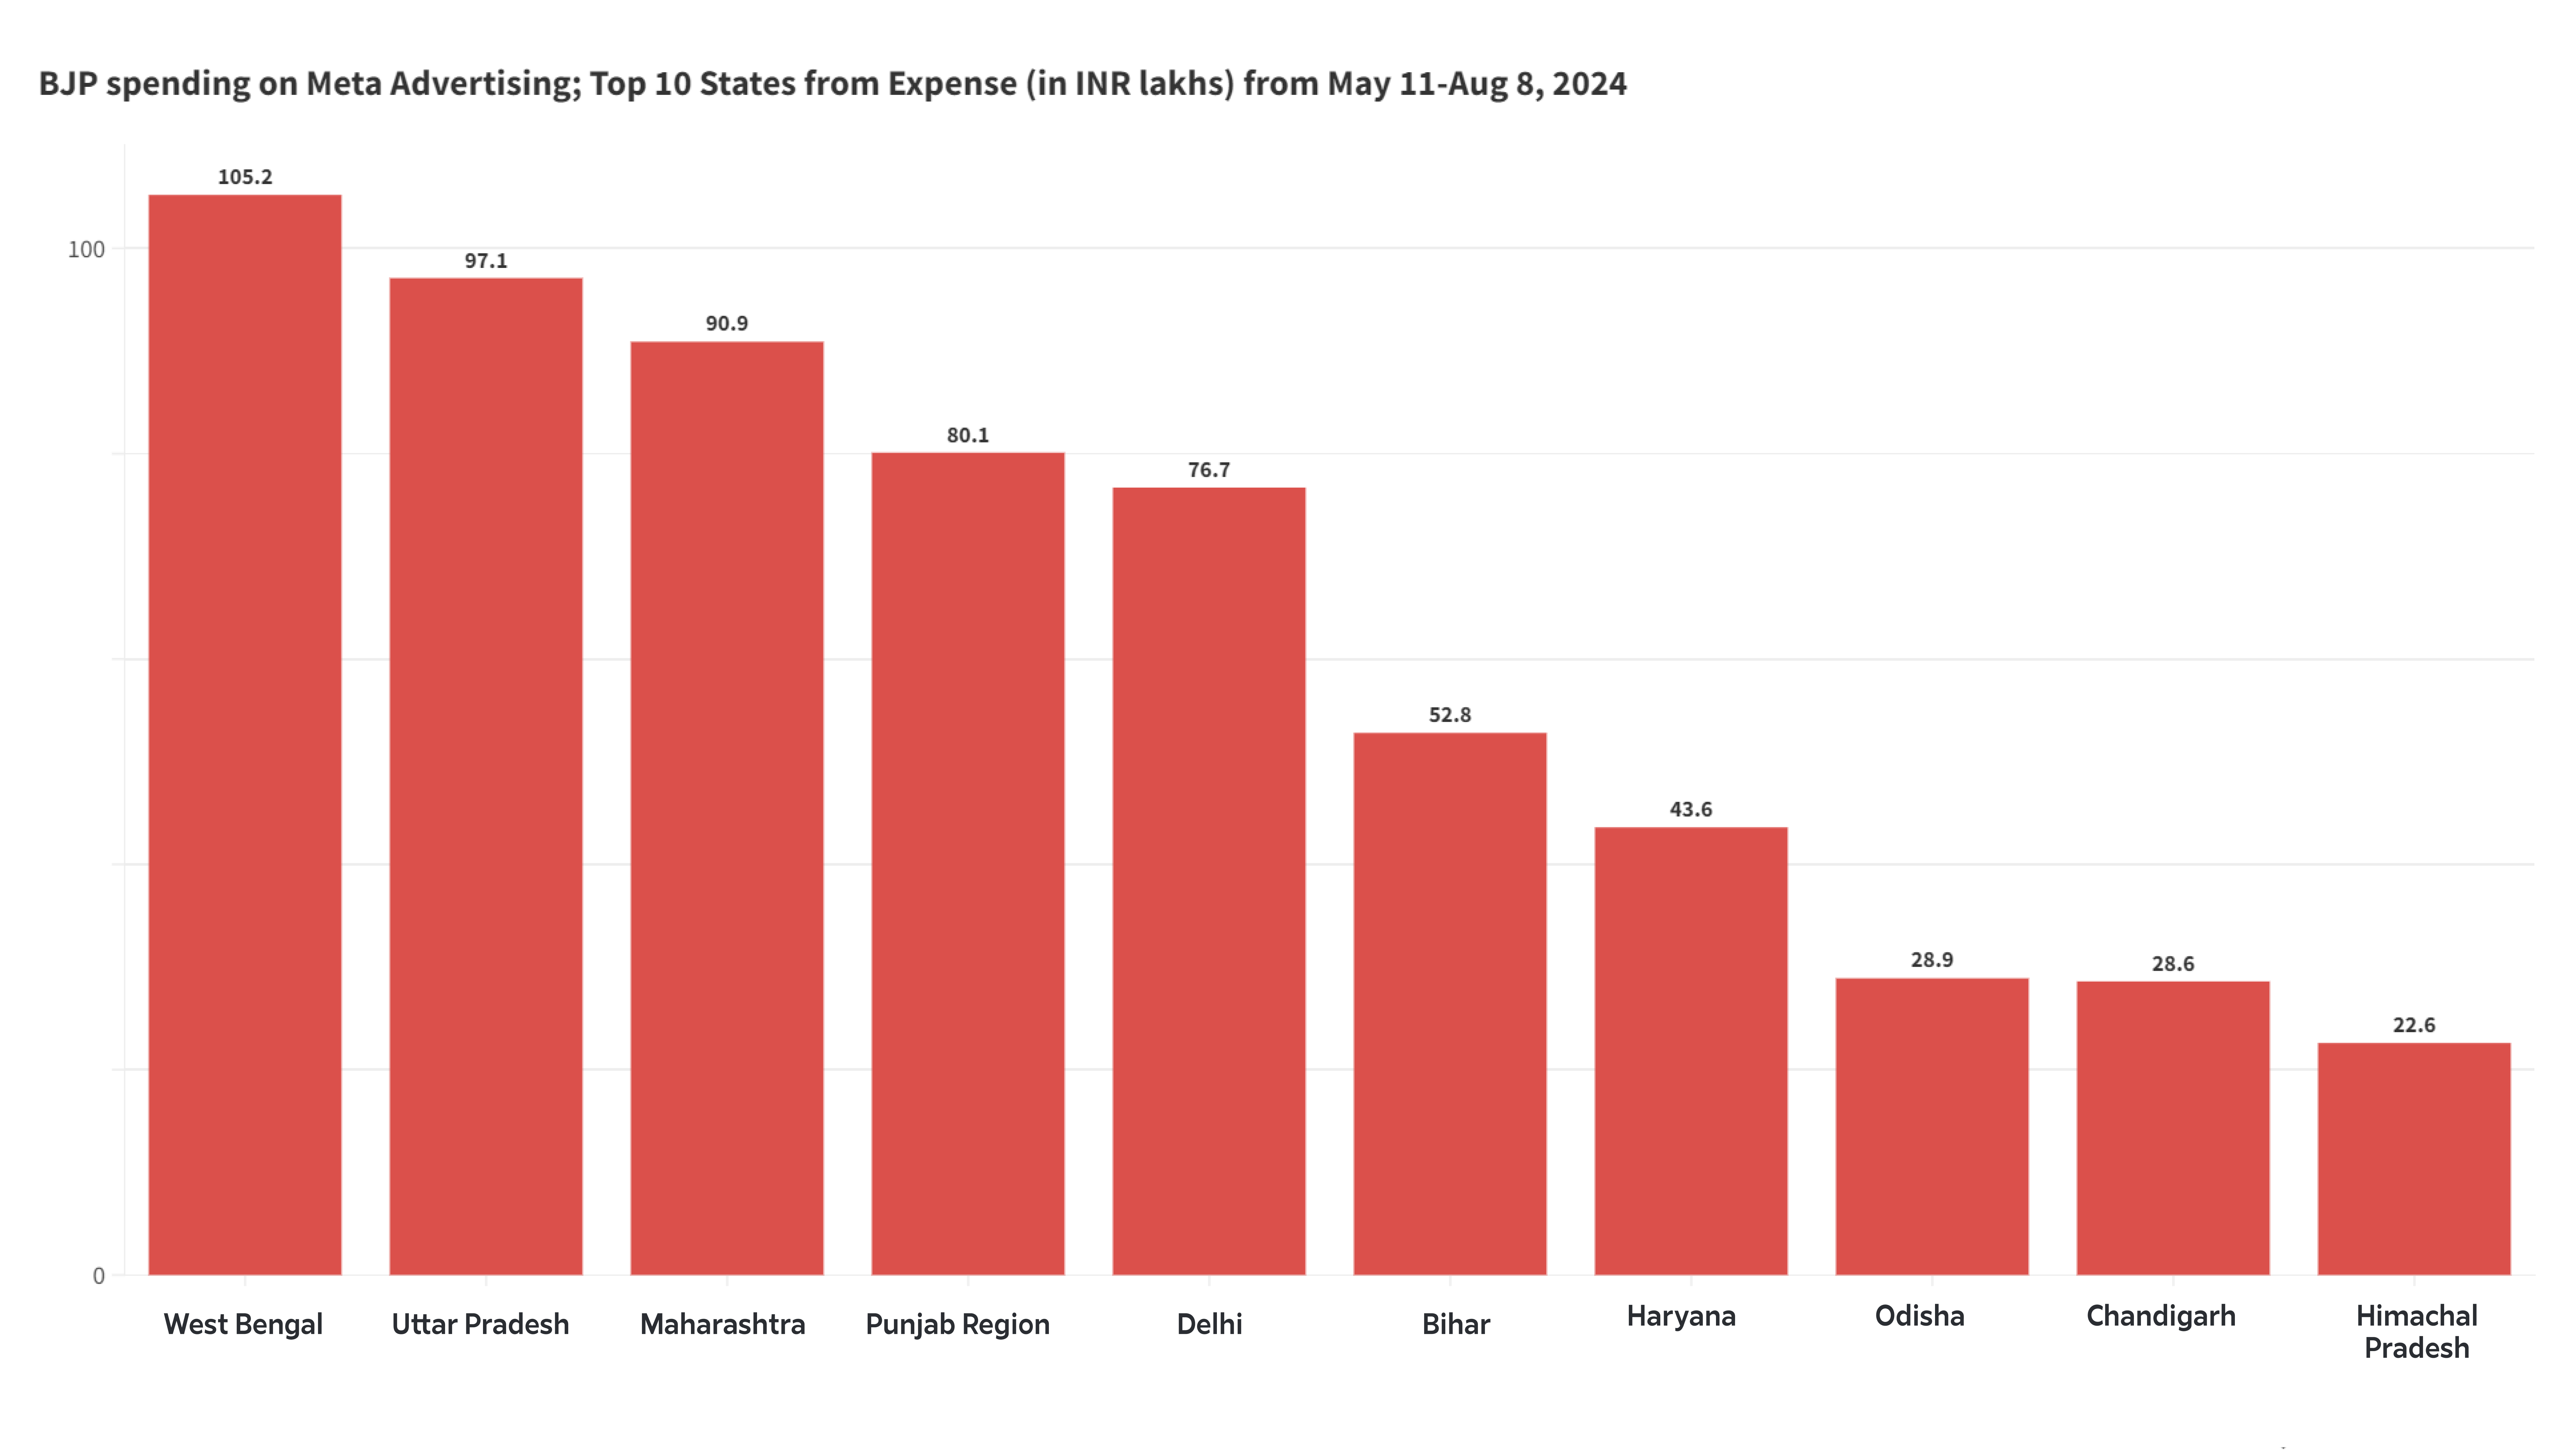
Figure 5. BJP spending on Meta Advertising from May 11-Aug 8, 2024
Source: Author’s calculations.
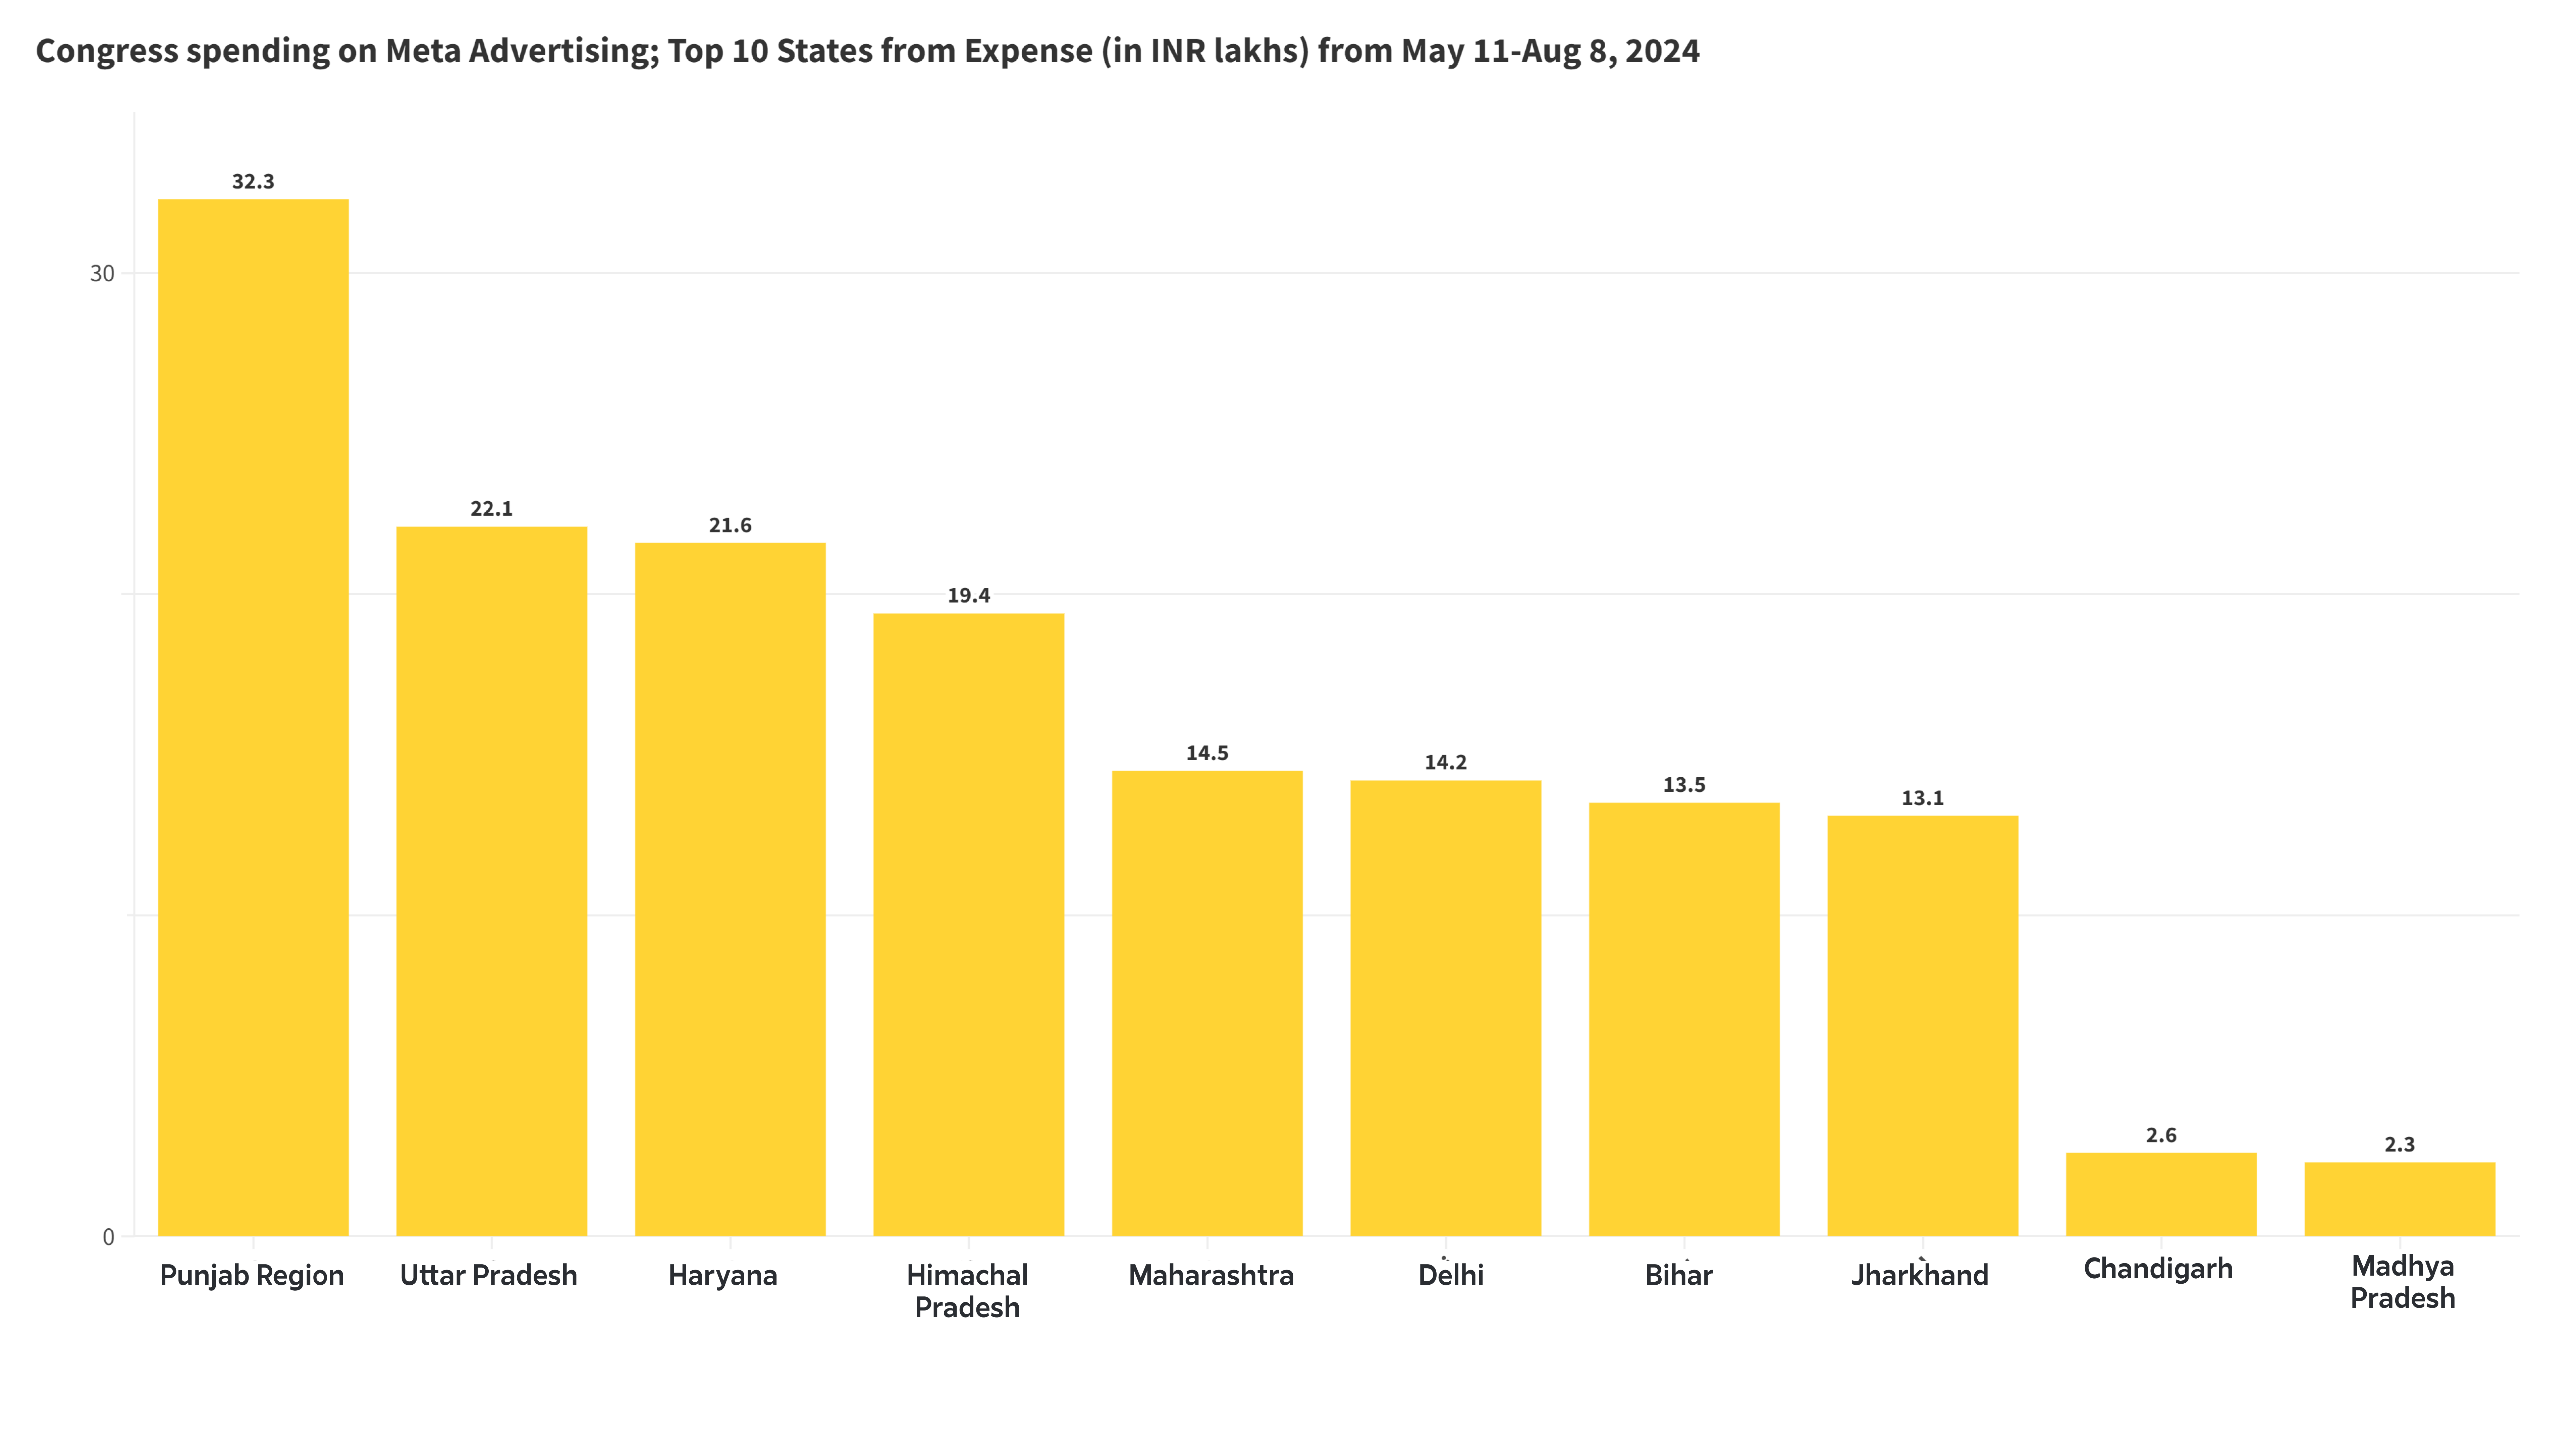
Figure 6. Congress Spending on Meta Advertising from May 11-Aug 8, 2024
Source: Author’s calculations.
Figure 7 looks at the 6 states common to both the BJP and the INC, where the highest expenditures were made on Meta advertising. In each state, the INC expenditure is only a fraction of the BJP’s expense. The data indicates that wherever the political contest was fierce, there were massive expenditures on social media. The opposition, Congress, was chasing different dynamics. This year, their highest expenditure was in states such as UP, Punjab, and Haryana–all states where the Congress emerged to gain lost ground from previous elections, with the UP results being perceived as a negative shock by the ruling BJP. Notably, these states are where Congress aimed to drastically overturn the political scenario. Furthermore, these states are scheduled for assembly elections immediately following the general elections, where Congress aspires to stage a significant comeback.
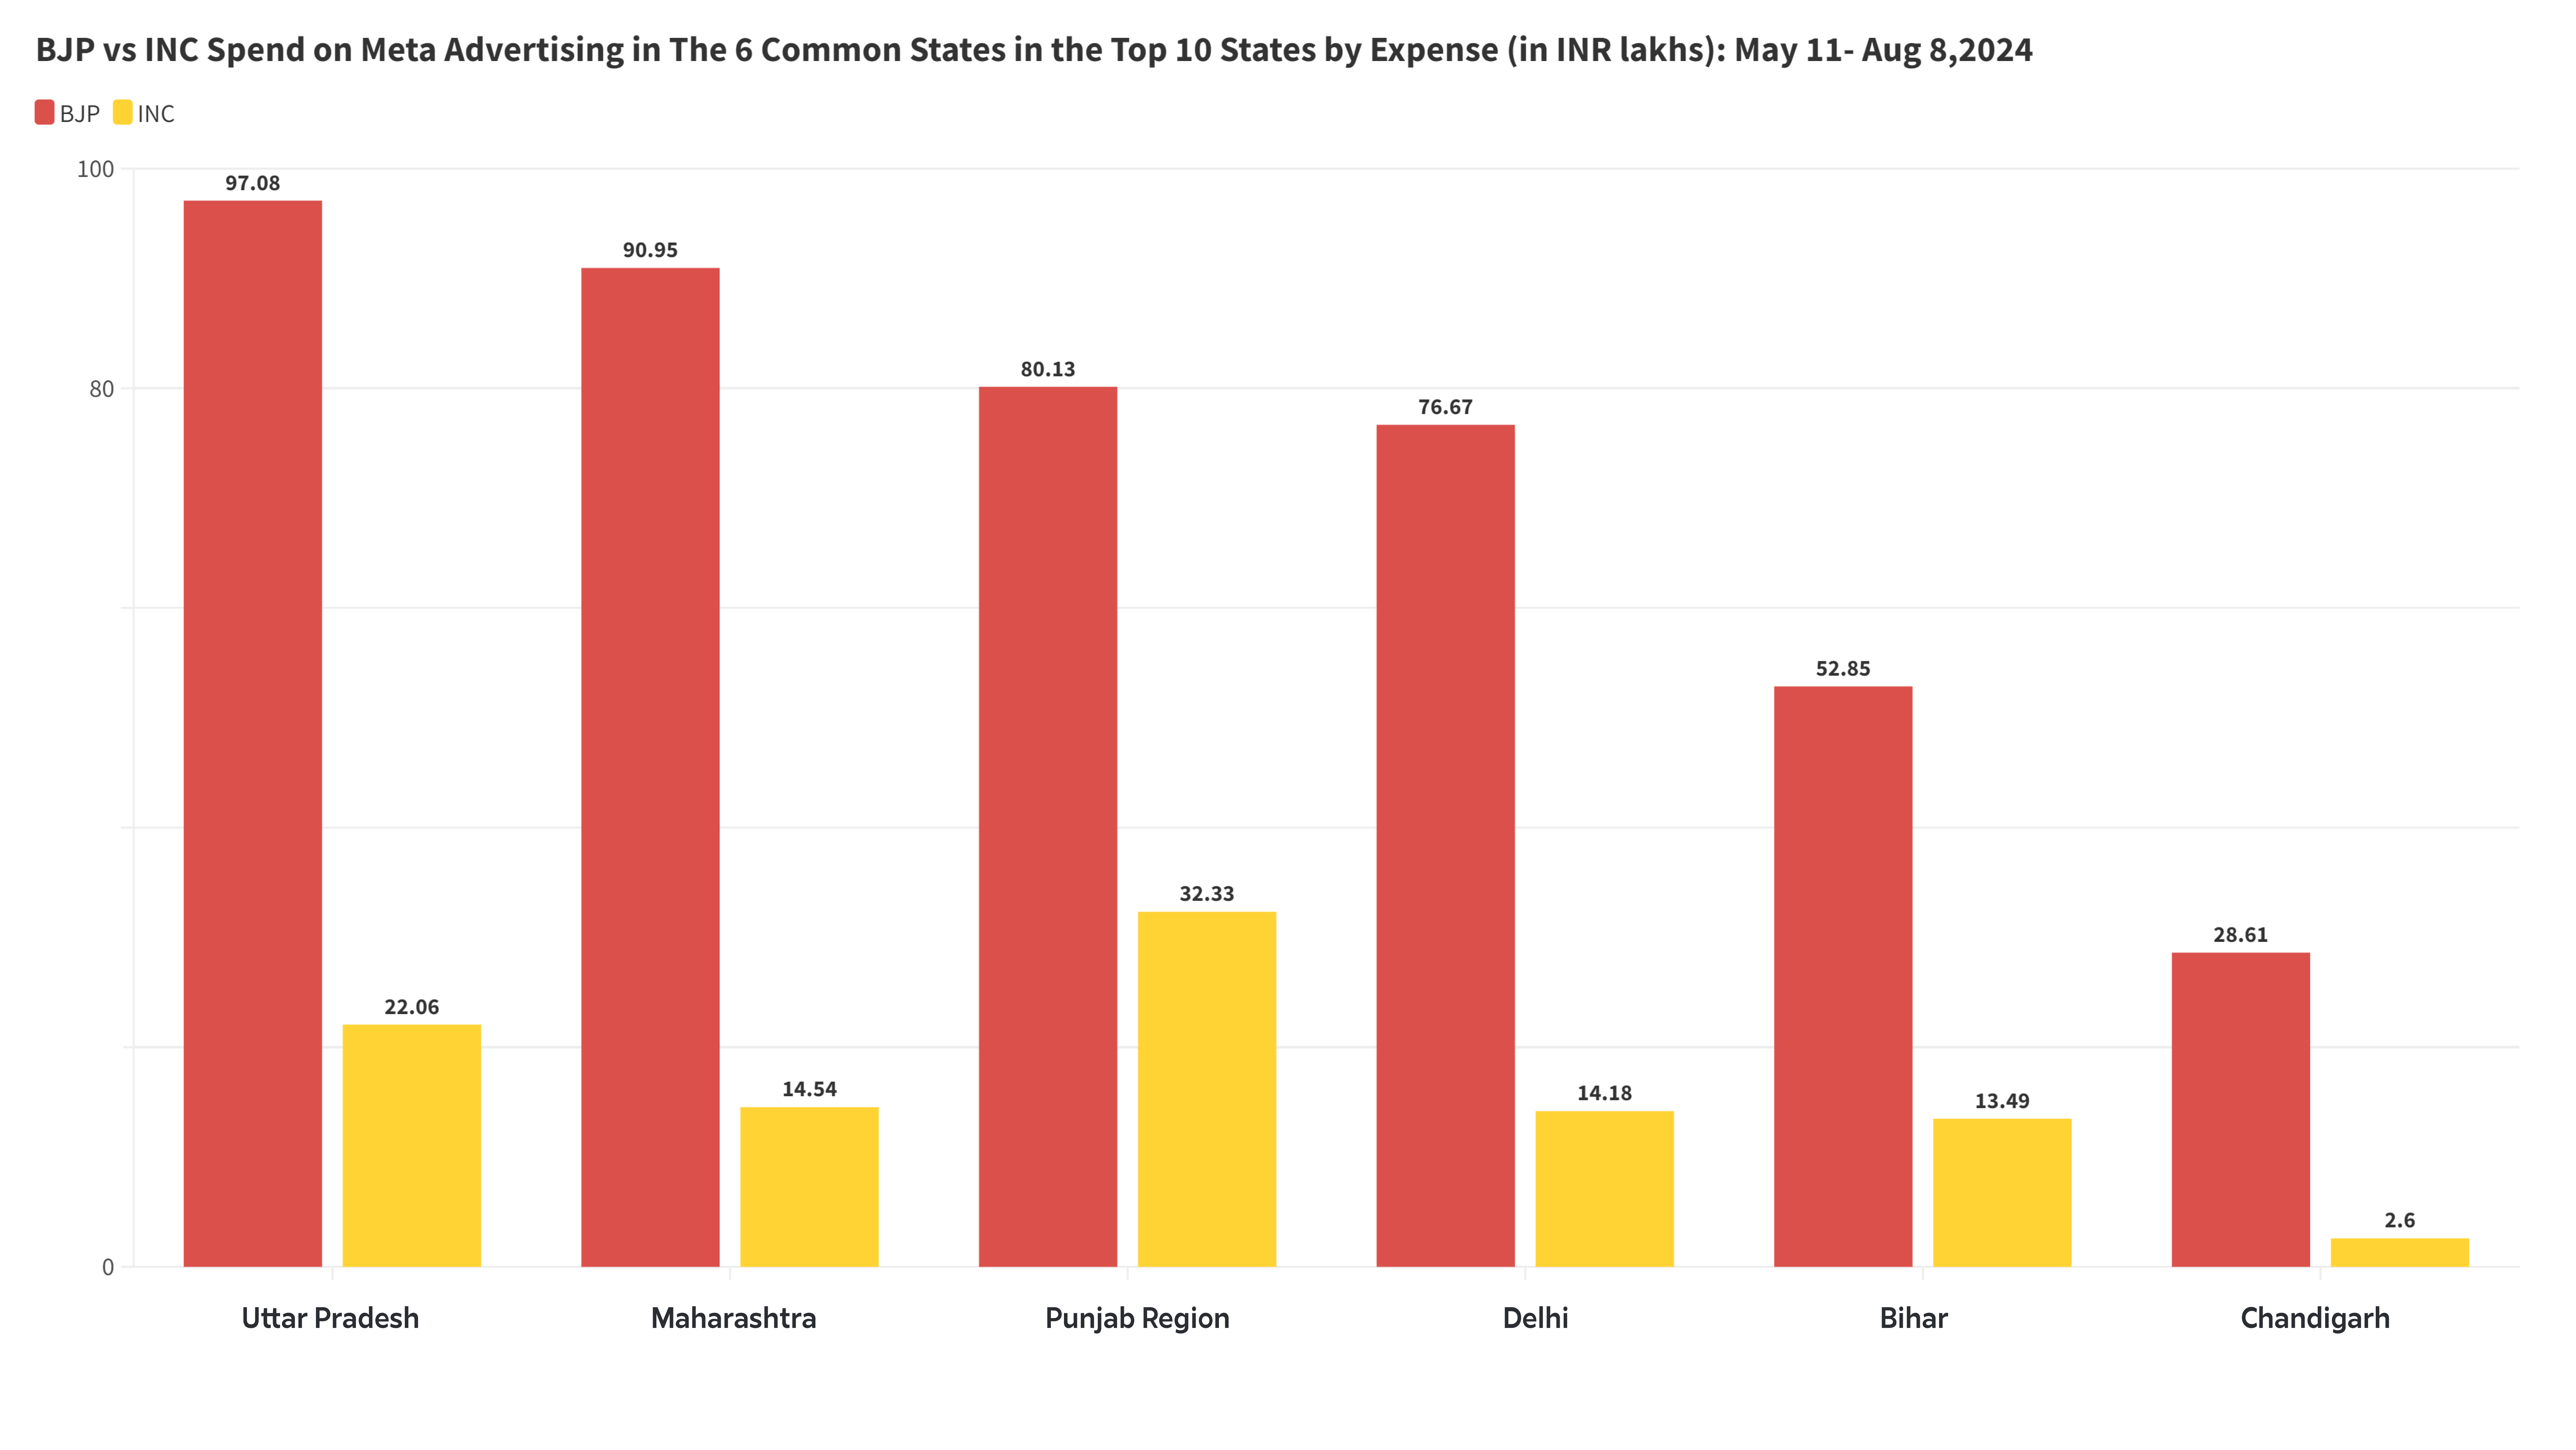
Figure 7. Comparison of Meta Spending by BJP and INC in Six Common States (May 11-Aug 8, 2024)
Source: Author’s own calculations.
While the BJP’s strategy was more state-specific, the Congress concentrated on maximising gains from Northern and Western states. Notably, despite leading a costly campaign in Karnataka in 2023, the Congress indicated a marked reluctance to expend resources to elevate its efforts in the state during the general elections.
West Bengal emerged as a key political contest for the BJP and the AITC, with both parties aiming to increase their vote share and seats in a significant way. This came against the backdrop of political scandals in Bengal, which the BJP aimed to leverage. However, the prevailing opinion in favour of the AITC lay in the women and minority voters, who sided overwhelmingly with the AITC.
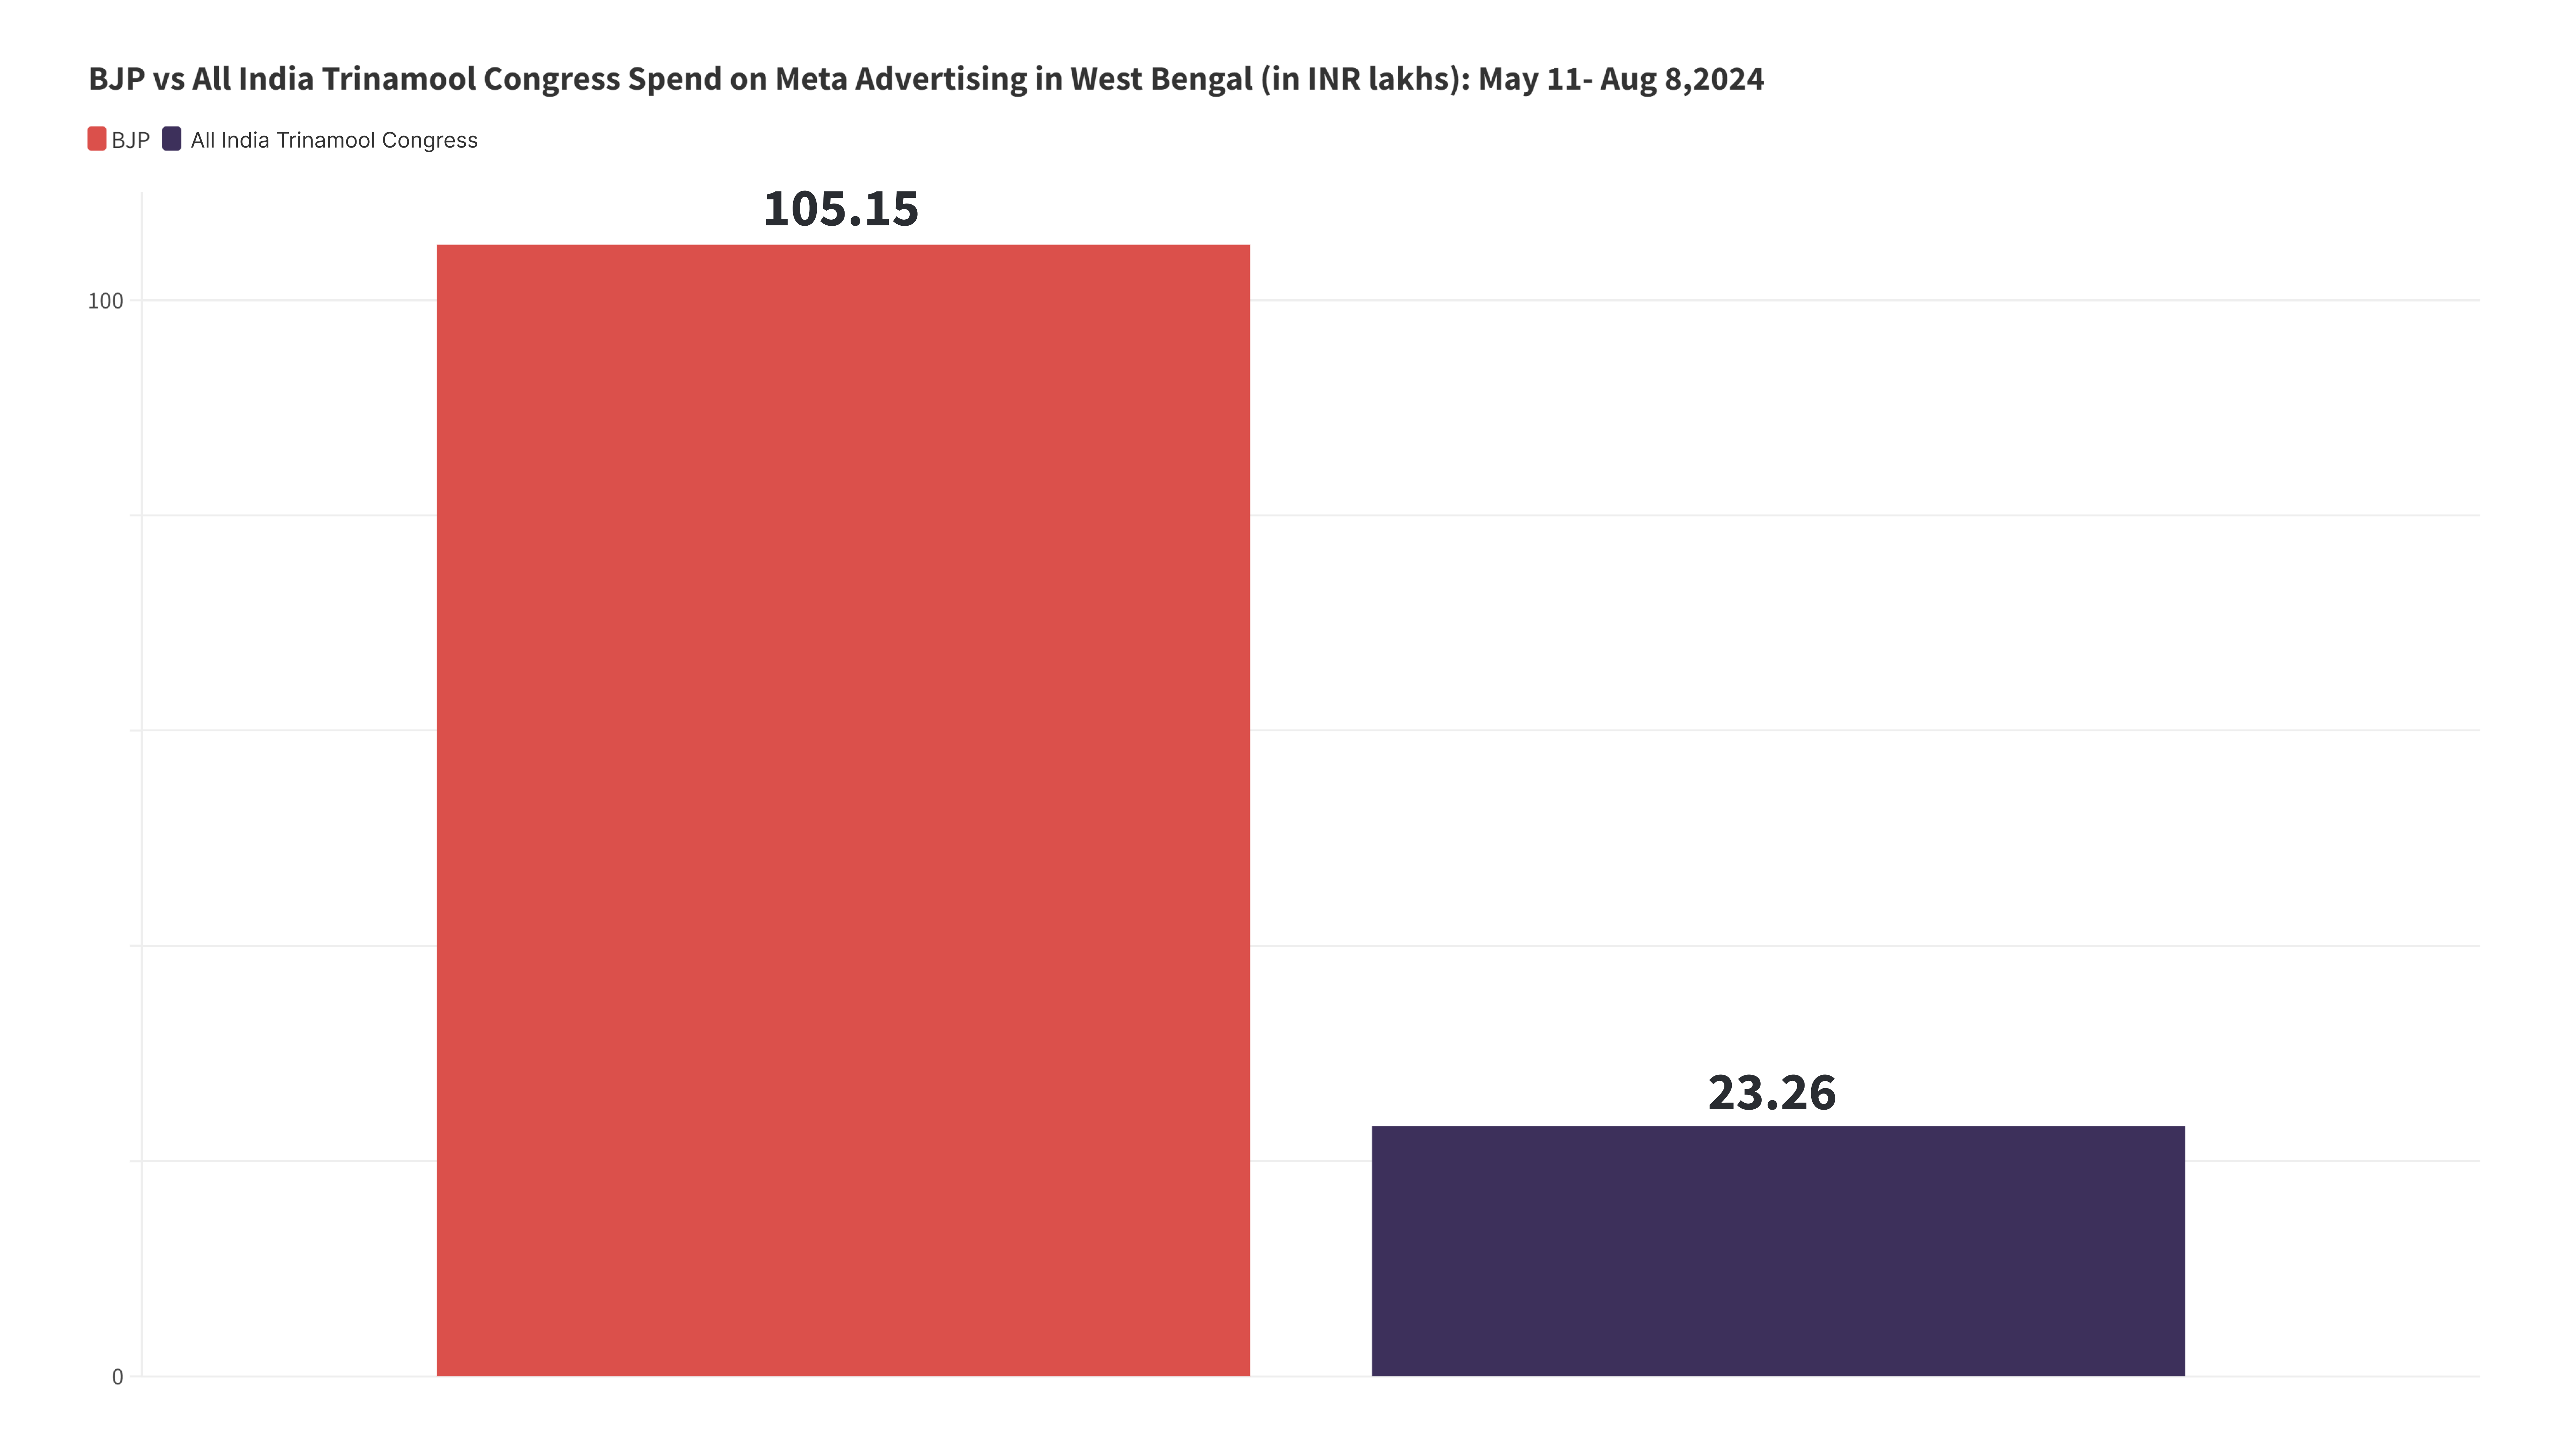
Figure 8. Comparison of Meta Spending by BJP and Trinamool Congress in West Bengal (May 11-Aug 8, 2024)
Source: Author’s own calculations.
However, the spending power of the BJP in Bengal remained quite large, with the advertising spend of the AITC being just about a fourth of what the BJP spent, as shown in Figure 8. The BJP had been making considerable inroads into Bengal over the last assembly and general elections, and thus, perceived the loss of MP seats as a surprise.
Similar trends emerge for Google ad expenditure made in 2024, with Odisha topping the list, followed by the larger states with tough political contests. Odisha seemed to have put more money into Google advertising than Meta, whereas, other states saw a similar share of Meta and Google advertising trend.
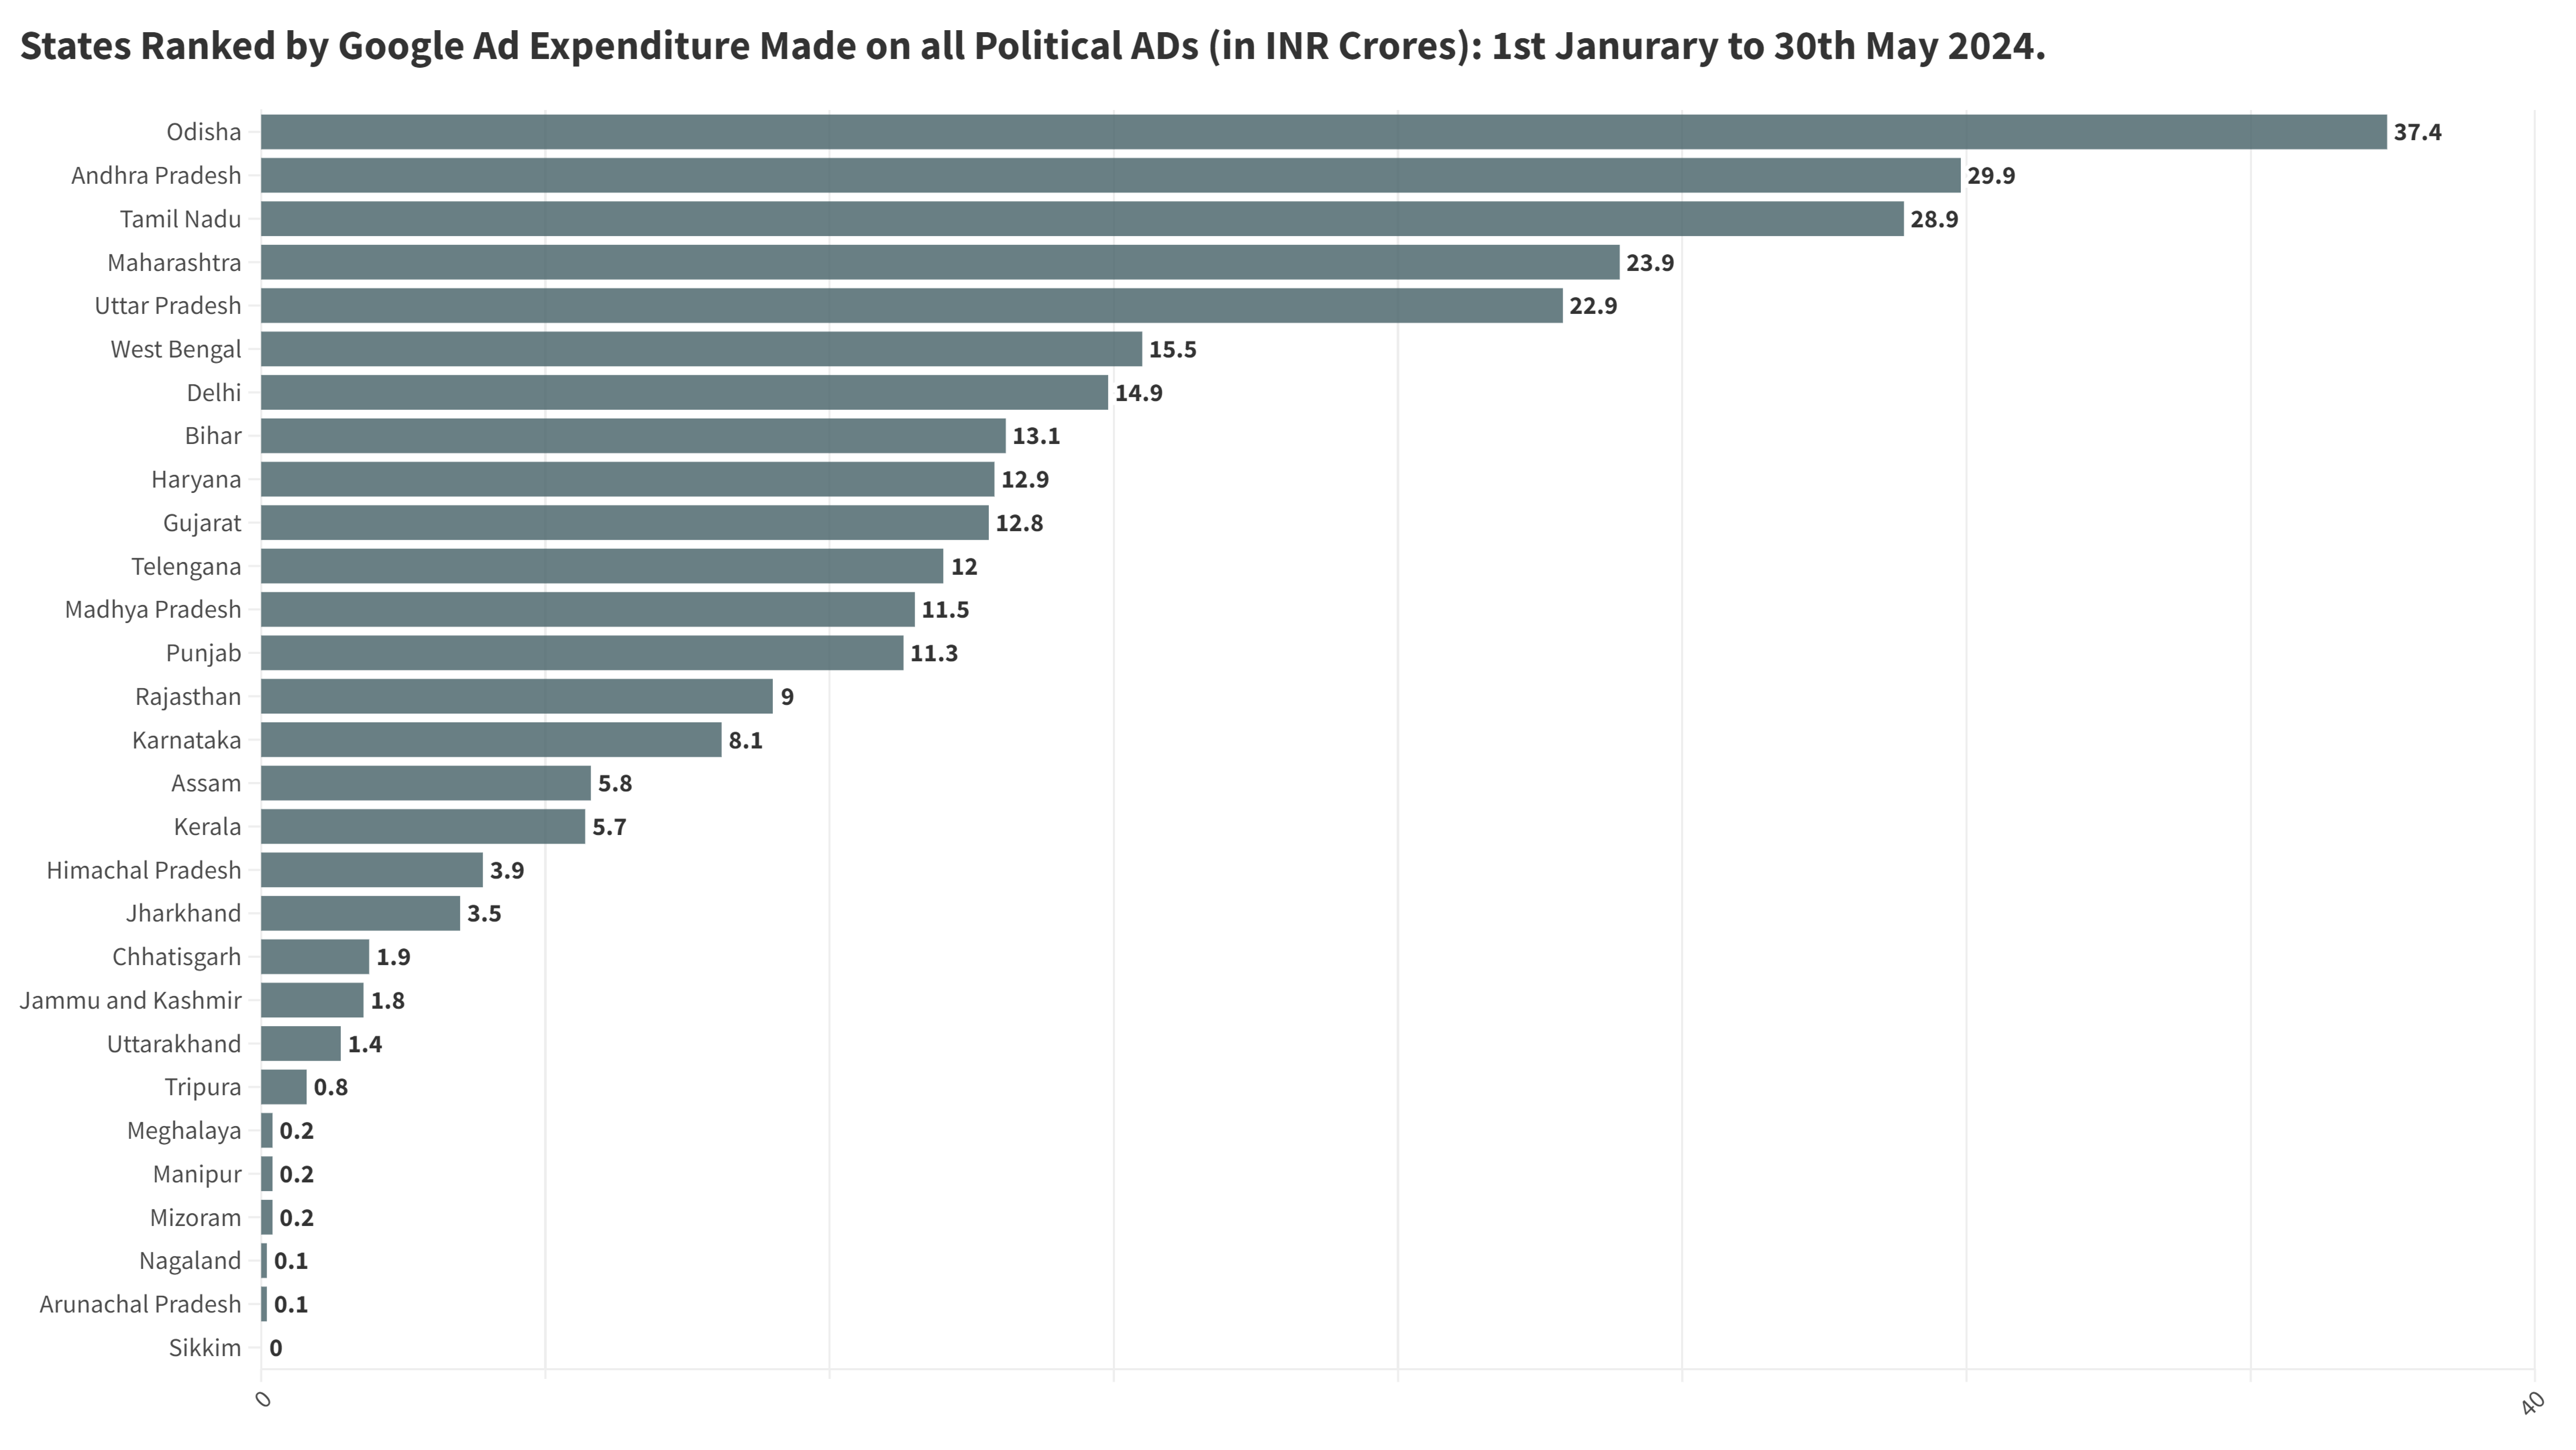
Figure 9. States Ranked by Google Ad Expenditure on Political Ads (Jan 1-May 30, 2024)
Source: Author’s own calculations.
Once again, the BJP emerged as the highest spender on Google advertising, with the following opposition parties combined amounting to almost the same amount spent by the BJP. TDP, a key BJP ally, spent relatively less in comparison with other parties on Google. Surrogate advertising played a role in Google ads as well, with DMK and AITC using Populus Entertainment and IPAC respectively as the firms through which they produced Google advertisements.
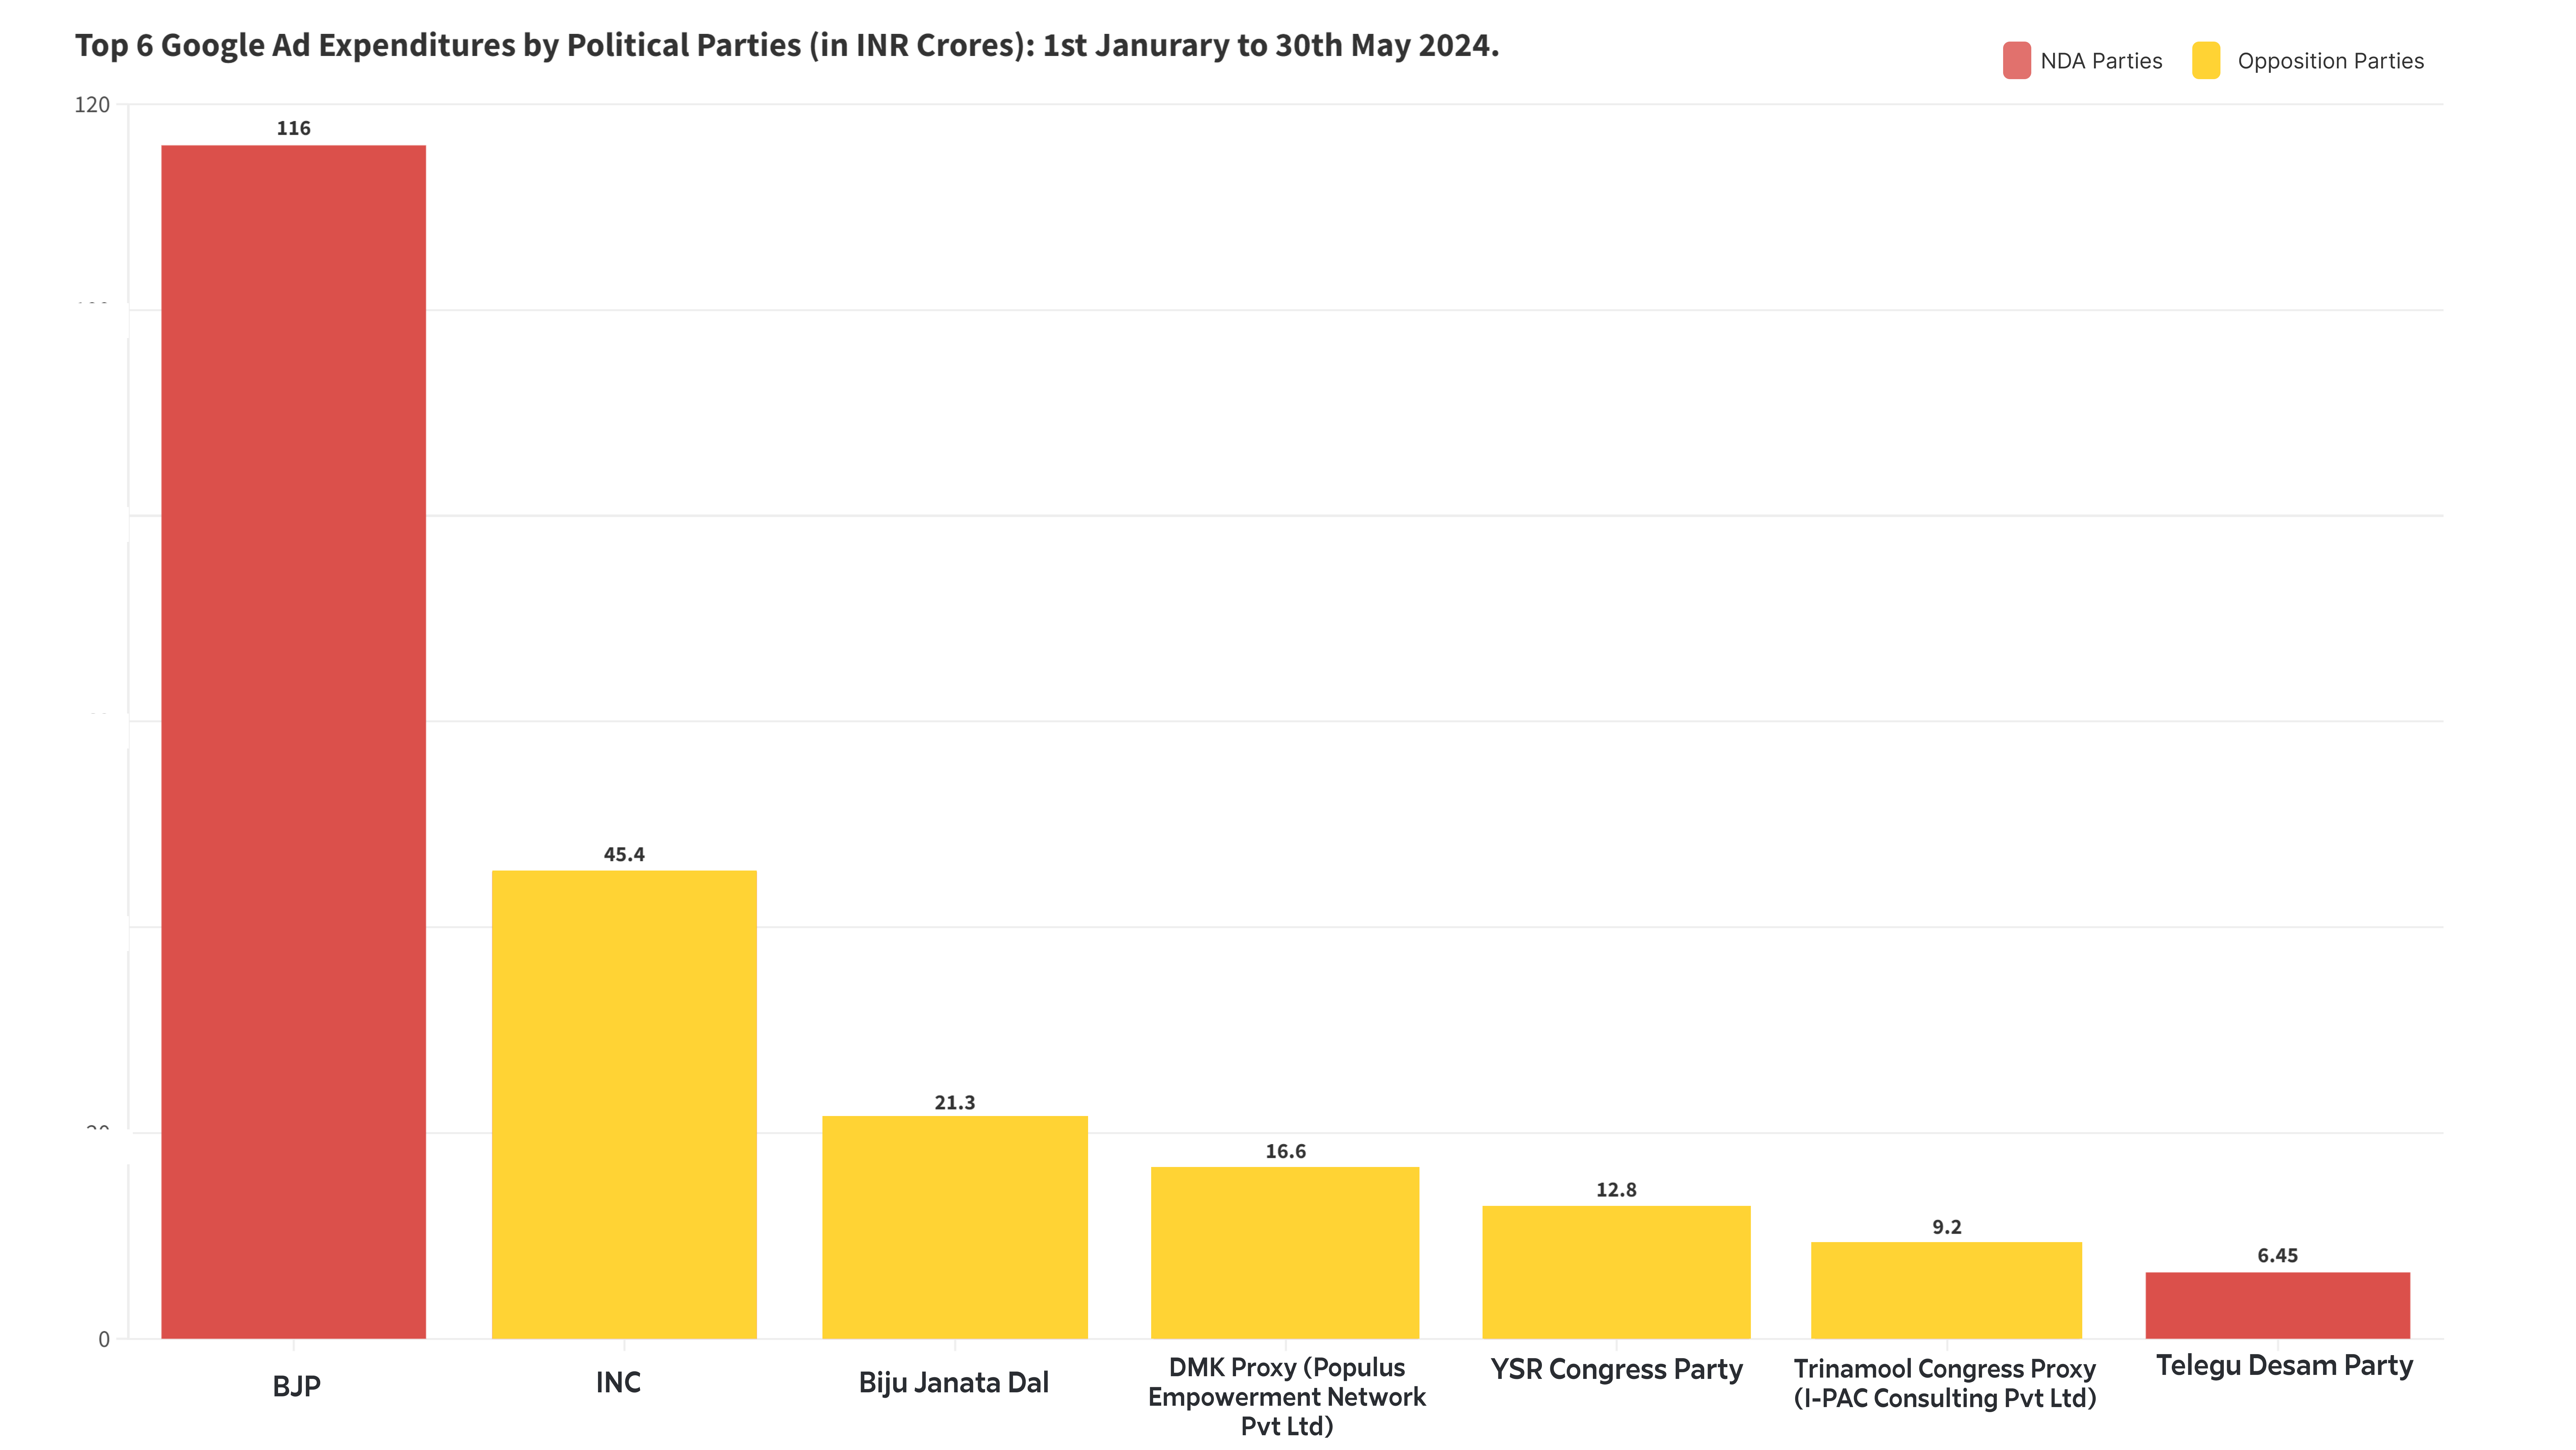
Figure 10. Top Six Google Ad Expenditures by Political Parties (Jan 1-May 30, 2024)
Source: Author’s calculations.
Key Takeaways: Fierce Contests and Emerging Political Landscape on Social Media
It appears that wherever the political contest was considered fierce, the social media advertising campaigns proved to be more expensive, indicating that parties spent much more on ads and other content. A close contest saw parties using social media to appeal to the non-aligned, or the fence-sitters, as a few percentage of voters could turn the outcome significantly. Such was seen notably in West Bengal and Odisha, both states where the BJP expected to make key gains. However, the higher social media spending in Bengal did not improve the BJP’s outcomes, whereas the BJP came to power for the first time in Odisha. This indicates that while social media spending accompanies political campaigning, its effect on actual voter attitudes is ambiguous and remains to be studied.
The trend so far suggests a clear picture of an emerging culture of political campaigning and manoeuvring via social media spaces. As discussed previously, social media offers much better targeting of demographics via algorithms, while also allowing for significantly faster spread of news. However experts have often cast doubt upon the quality of discourse generated on social media, alleging that the nuances of facts and political realities may often get missed due to the nature of the short-form consumable content. Additionally, there is a stress on “virality” upon which social media campaigns- political and otherwise- hinge, which incentivises the creation of mildly controversial or scandalous content to incite excitement among the audience.
The same was seen numerous times during the general elections of 2024, where various ads or posts by surrogate pages aligned with the ruling BJP published content that vilified certain communities and members of the opposition party. These ads were subsequently taken down by the platforms after being reported, but often kept coming back up through a vast network of surrogate pages.
